K-Means Clustering in Python (Unsupervised Learning)
The K-means clustering algorithm is a class of unsupervised learning algorithm that takes an unlabeled dataset and divides it into a user defined number of clusters. These clusters consists of data-points which are more similar to each other than the members of the other cluster.
It can be thought of as a crude form of pattern recognition.
The algorithm can handle any number of features for each data-point but with the condition that all of them are numerical values rather than nominal. Categorical data needs to be converted into binary tags.
 |
| Image taken from the web |
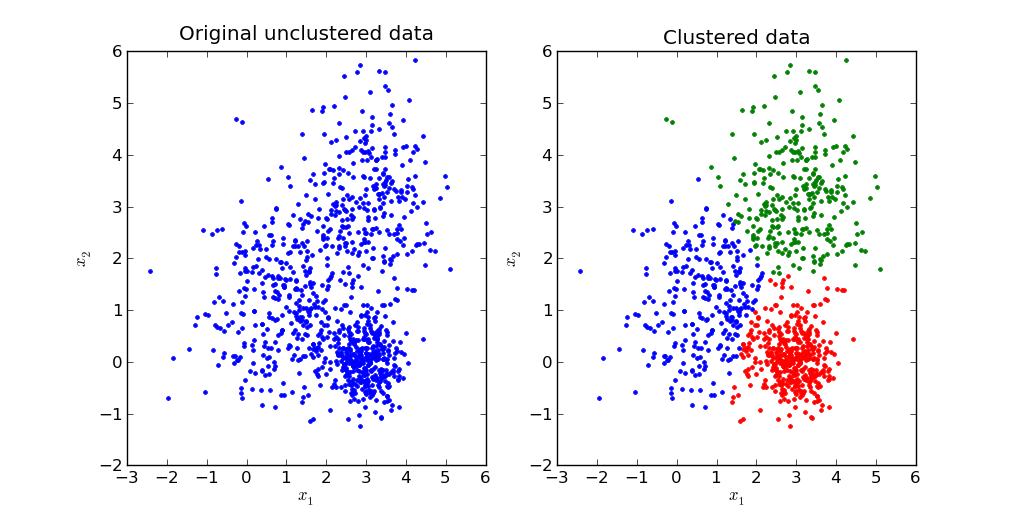
Usually playing around with the number of clusters and plotting them for visual verification is a good practice.
The python code has been provided below. You can also download it and all of my other code from my Github page. As always, any improvement or contribution will be appreciated.
Note: You will need to have pre-installed numpy and pandas libraries before running the code . The program itself is plug and play
The code...
###################################################################
"""K means clustering"""
import pandas as pd
import numpy as np
if __name__=="__main__":
print("welcome to the k means clustering package. this program will help you\n\
create a user defined number(K) of clusters of similar data points\n\
the clusters are created based on a crude techineqe of pattern recognition\n\
This algorithm only works on numerical data\n\
So lets begin...")
####load dataset
da=raw_input("please mentation the name of your data file (only csv file formats accepted)\n")
kay=raw_input("how many clusters would you like to create?\n")
k=int(kay)
dat=pd.read_csv(da);
d=np.mat(dat);
n=d.shape[1]
m=d.shape[0]
a=1
b=-1
cento=np.mat(np.random.rand(k,n))
cent=a+(b-a)*cento
norm=np.mat(np.zeros(shape=(1,n)))
#normalization
for i in range(d.shape[1]):
norm[0,i]=max(d[:,i])-min(d[:,i])
nd=np.mat(np.zeros(shape=(m,n)))
for i in range(n):
for j in range(m):
nd[j,i]=(max(d[:,i])-d[j,i])/norm[:,i]
"""for l in range(len(nor)):
norm[:,l]=nor[l]
#kMeans(nd,k,cent,distMeas=distEclud)
m = d.shape[0]"""
clustertag=np.mat(np.zeros((m,1)))
meansumk=np.mat(np.zeros((1,n)))
newcent=np.mat(np.zeros((k,n)))
box=np.mat(np.zeros((k,n)))
#print norm,nd
while 1:
for i in range(m):
box[:,:]=d[i,:]
#print box
sqdif =np.power((box-cent),2)
root=np.power(sqdif,0.5)
rsum=root.sum(axis=1)
indexleast=np.argsort(rsum,axis=0)
clustertag[i,0]=indexleast[0]
print indexleast
for i in range(k):
count=0
for j in range(m):
if clustertag[j,0]==i:
meansumk[0,:]=meansumk[0,:]+d[j,:]
count+=1
newcent[i,:]=meansumk/count
cent=newcent
if newcent.all()-cent.all()==0:
break
lom=np.mat(np.zeros((k,n)))
print ("The centroids of the %i clusters are...\n"%k)
for h in range(k):
lom[h,:]=np.multiply(norm[0,:],cent[h,:])
print lom
##############################################
What the input should look like

What the output would be like...
The output will be a matrix of K number of rows representing the centroid of the each cluster. You can also think of it as an average feature vector of that particular cluster.
Thanks for posting the useful information to my vision. This is excellent information.
ReplyDeletevision inspection system manufacturers